Assessing Bitcoin’s current market dynamics – Low Inflows, high leverage, and…
Open Interest and liquidations data had some interesting observations for Bitcoin’s price performance.

Key Takeaways
Содержание статьи:
- Cycle low of Bitcoin inflows to Binance may be an encouraging sight for long-term holders. And yet, other metrics suggested that traders should still beware short-term volatility on the charts.
Bitcoin [BTC] nearly hit its all-time high on Wednesday, 09 July, falling just $60 short of $111,970. This push came alongside $229.28 million worth of positions being liquidated in the last 24 hours.
Only $12.8 million were long positions. This imbalance highlights the effectiveness of the short squeeze. In fact, a mammoth $7.8 million worth of short liquidations were triggered within a minute on Binance.

Source: CryptoQuant Insights
In a post on CryptoQuant, analyst Darkfost observed that the amount of Bitcoin inflows to the largest centralized exchange, Binance, was extremely low. These low inflows were at the lowest point they have been during the entire cycle, even as the price nearly set a new all-time high.
According to the live chart, the monthly average for inflows was 5.39k BTC, and the daily average was at 3.19k BTC. Usually, inflows represent an intent to sell. The low inflows to the largest exchange indicated unwillingness to sell Bitcoin, pointing towards strong holder conviction.
While this short squeeze saw a sizeable chunk of liquidity taken out, the past few hours of trading saw BTC thrown back to the $110.8k-level. This suggested a price move to grab liquidity, raising questions on what to expect next.
Explosive rally or slow, choppy grind ahead?

Source: Coinglass
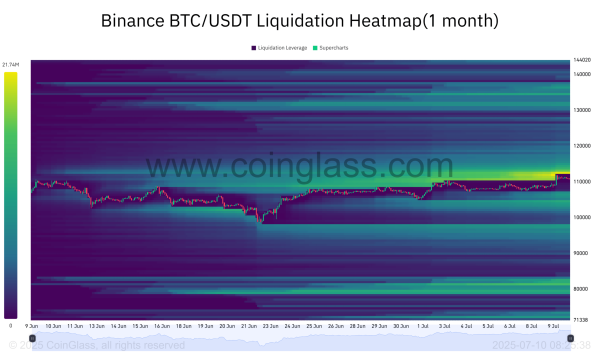
The 1-month liquidation heatmap highlighted the liquidity at $110k that was swept recently.
It also showed another magnetic zone at $112.6k, which could be revisited soon. Over the past two weeks, Bitcoin has moved sideways, letting liquidity build up both above and below it, before gravitating to these liquidity pockets.

Source: CryptoQuant
There appeared to be another warning sign for traders though.
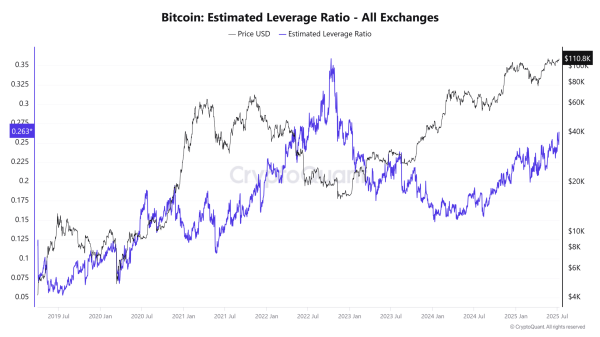
The estimated leverage ratio has been trending higher since April. It saw a sizeable spike in early July, as BTC approached the $108k-mark. This indicated an increased willingness to assume risk in the derivatives market. The hike in Open Interest could set up conditions for liquidity grabs, as we saw recently.

Source: CryptoQuant
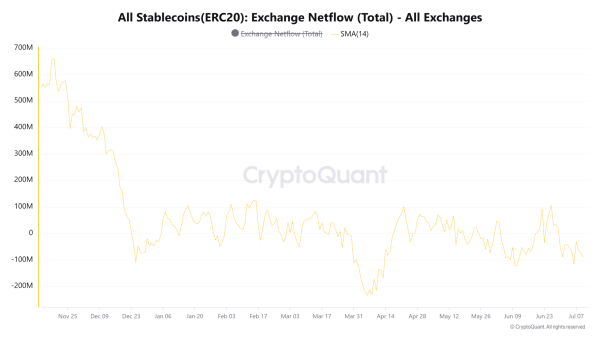
The stablecoin netflows’ 14-day moving average showed stablecoins flowing out of exchanges since 30 June. A fall in stablecoins on exchanges implies a fall in buying power, which could hurt the chances of an organic crypto market rally. There should be caution regarding immediate, new demand in the market.
The low BTC inflows underlined a lack of willingness to sell, but the stablecoin flows indicated reduced buying power. The Open Interest and liquidations data showed a market eager to jump between liquidity pockets and the threat of significant volatility in the short term.
Hence, traders should remain cautious, while spot holders need to remain patient.
Subscribe to our must read daily newsletter
Next: Breaking down dogwifhat’s 13% surge – Can WIF flip $1?
Source
